Graph a bivariate plot of temperature and humidity data
Source:R/graph_TRHbivariate.R
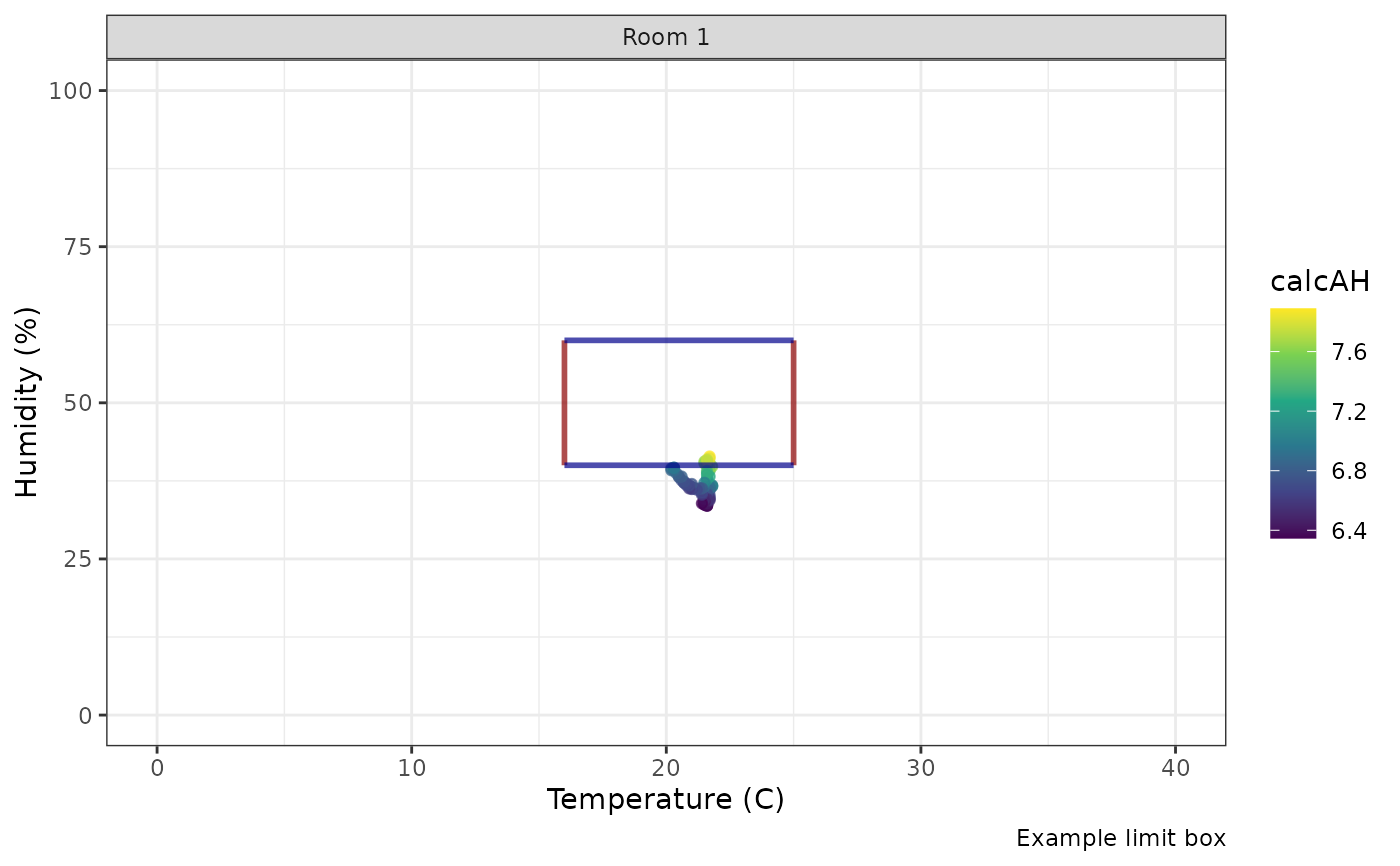
graph_TRHbivariate.RdPlots temperature vs relative humidity points coloured by a selected environmental metric calculated from temperature and humidity variables using ConSciR functions.
Arguments
- mydata
A data frame containing temperature (Temp) and relative humidity (RH) columns.
- Temp
The name of the column in mydata containing temperature data ("Temp").
- RH
The name of the column in mydata containing relative humidity data ("RH").
- z_func
A character string specifying which environmental metric function to use. See details for options (default `none`).
- facet_by
Name of categorical column to facet by; defaults to "Sensor".
- LowT
Numeric value for lower temperature limit of the target range. Default is 16°C.
- HighT
Numeric value for upper temperature limit of the target range. Default is 25°C.
- LowRH
Numeric value for lower relative humidity limit of the target range. Default is 40%.
- HighRH
Numeric value for upper relative humidity limit of the target range. Default is 60%.
- Temp_range
Numeric vector of length two defining x-axis plot limits for temperature.
- RH_range
Numeric vector of length two defining y-axis plot limits for relative humidity.
- alpha
Numeric transparency level for points.
- limit_caption
Character string caption describing plot limits.
Value
A ggplot2 plot object showing temperature vs relative humidity colored by the selected metric, with annotated boundary segments.
Details
Humidity and conservation functions can be used for the y-axis.
calcHR: Humidity Ratio (g/kg)
calcMR: Mixing Ratio (g/kg)
calcAH: Absolute Humidity (g/m^3)
calcSH: Specific Humidity (g/kg)
calcAD: Air Density (kg/m^3)
calcDP: Dew Point (°C)
calcFP: Frost Point (°C)
calcEnthalpy: Enthalpy (kJ/kg)
calcPws: Saturation vapor pressure (hPa)
calcPw: Water Vapour Pressure (hPa)
calcPI: Preservation Index
calcLM: Lifetime
calcEMC_wood: Equilibrium Moisture Content (wood)
Examples
# mydata file
filepath <- data_file_path("mydata.xlsx")
mydata <- readxl::read_excel(filepath, sheet = "mydata", n_max = 100)

graph_TRHbivariate(
  mydata,
  z_func = "calcAH",
  LowT = 16, HighT = 25,
  LowRH = 40, HighRH = 60,
  Temp_range = c(0, 40),
  RH_range = c(0, 100),
  alpha = 0.7,
  limit_caption = "Example limit box"
)
#> Warning: `aes_string()` was deprecated in ggplot2 3.0.0.
#> ℹ Please use tidy evaluation idioms with `aes()`.
#> ℹ See also `vignette("ggplot2-in-packages")` for more information.
#> ℹ The deprecated feature was likely used in the ConSciR package.
#>   Please report the issue at <https://github.com/BhavShah01/ConSciR/issues>.
#> Warning: Using `size` aesthetic for lines was deprecated in ggplot2 3.4.0.
#> ℹ Please use `linewidth` instead.
#> ℹ The deprecated feature was likely used in the ConSciR package.
#>   Please report the issue at <https://github.com/BhavShah01/ConSciR/issues>.