Introduction
ConSciR provides tools for the analysis of cultural
heritage preventive conservation data. It includes functions for
environmental data analysis, humidity calculations, sustainability
metrics, conservation risks, and data visualisations such as
psychrometric charts. It is designed to support conservators,
scientists, and engineers by streamlining common calculations and tasks
encountered in heritage conservation workflows. The package is motivated
by the framework outlined in Cosaert and Beltran et al. (2022) “Tools for the Analysis of Collection
Environments”.
Install and load
install.packages("ConSciR")
library(ConSciR)
You can install the development version of the package from GitHub
using the pak package:
install.packages("pak")
pak::pak("BhavShah01/ConSciR")

# Alternatively
# install.packages("devtools")
# devtools::install_github("BhavShah01/ConSciR")
Visit the package GitHub page for updates and source code: ConSciR Github
This vignette provides a practical introduction to the package’s
functionalities. For full details on all functions, see the package Reference
manual or use ?function_name within R.
Examples
Load some useful packages:
Add calculated values
Transform your dataset with the functions in ConSciR:
filepath <- data_file_path("mydata.xlsx")
mydata <- readxl::read_excel(filepath, sheet = "mydata")
mydata <- mydata |> filter(Sensor == "Room 1")


# Add calculated values using mutate
head(mydata) |>
  mutate(

    # Humidity functions
    Absolute_Humidity = calcAH(Temp, RH),
    Dew_Point = calcDP(Temp, RH),
    Mixing_Ratio = calcMR(Temp, RH),
    Humidity_Ratio = calcHR(Temp, RH),
    Enthalpy = calcEnthalpy(Temp, RH),
    Saturation_Vapour_Pressure = calcPws(Temp),
    Actual_Vapour_Pressure = calcPw(Temp, RH),
    Air_Density = calcAD(Temp, RH),

    # Conservation risks
    Mould_Growth_Rate_mm_day = calcMould_Zeng(Temp, RH, label = TRUE),
    Mould_Growth_Limit = calcMould_Zeng(Temp, RH),
    Mould_Growth_Risk = ifelse(RH > Mould_Growth_Limit, "Mould risk", "No risk"),
    Mould_Growth_Index = calcMould_VTT(Temp, RH),
    Lifetime = calcLM(Temp, RH),
    Preservation_Index = calcPI(Temp, RH),
    EMC_Wood = calcEMC_wood(Temp, RH),

    # Sustainability calculations
    Temp_from_DP = calcTemp(RH, Dew_Point),
    RH_from_DP = calcRH_DP(Temp, Dew_Point),
    RH_from_AH = calcRH_AH(Temp, Absolute_Humidity),
    RH_if_2C_higher = calcRH_AH(Temp + 2, Absolute_Humidity)

  ) |>
  glimpse()
#> Rows: 6
#> Columns: 24
#> $ Site                       <chr> "London", "London", "London", "London", "Lo…
#> $ Sensor                     <chr> "Room 1", "Room 1", "Room 1", "Room 1", "Ro…
#> $ Date                       <dttm> 2024-01-01 00:00:00, 2024-01-01 00:15:00, …
#> $ Temp                       <dbl> 21.8, 21.8, 21.8, 21.7, 21.7, 21.7
#> $ RH                         <dbl> 36.8, 36.7, 36.6, 36.6, 36.5, 36.2
#> $ Absolute_Humidity          <dbl> 7.052415, 7.033251, 7.014087, 6.973723, 6.9…
#> $ Dew_Point                  <dbl> 6.383970, 6.344456, 6.304848, 6.216205, 6.1…
#> $ Mixing_Ratio               <dbl> 5.957278, 5.940935, 5.924593, 5.888156, 5.8…
#> $ Humidity_Ratio             <dbl> 5.957278, 5.940935, 5.924593, 5.888156, 5.8…
#> $ Enthalpy                   <dbl> 37.15665, 37.11512, 37.07359, 36.87888, 36.…
#> $ Saturation_Vapour_Pressure <dbl> 26.12119, 26.12119, 26.12119, 25.96205, 25.…
#> $ Actual_Vapour_Pressure     <dbl> 9.612598, 9.586477, 9.560356, 9.502110, 9.4…
#> $ Air_Density                <dbl> 1.192445, 1.192457, 1.192469, 1.192899, 1.1…
#> $ Mould_Growth_Rate_mm_day   <dbl> 0, 0, 0, 0, 0, 0
#> $ Mould_Growth_Limit         <dbl> 75.11542, 75.11542, 75.11542, 75.14014, 75.…
#> $ Mould_Growth_Risk          <chr> "No risk", "No risk", "No risk", "No risk",…
#> $ Mould_Growth_Index         <dbl> 0, 0, 0, 0, 0, 0
#> $ Lifetime                   <dbl> 1.107855, 1.108860, 1.109869, 1.109854, 1.1…
#> $ Preservation_Index         <dbl> 45.25849, 45.38181, 45.50580, 46.07769, 46.…
#> $ EMC_Wood                   <dbl> 7.201471, 7.186361, 7.171247, 7.173308, 7.1…
#> $ Temp_from_DP               <dbl> 21.8, 21.8, 21.8, 21.7, 21.7, 21.7
#> $ RH_from_DP                 <dbl> 36.8, 36.7, 36.6, 36.6, 36.5, 36.2
#> $ RH_from_AH                 <dbl> 36.8, 36.7, 36.6, 36.6, 36.5, 36.2
#> $ RH_if_2C_higher            <dbl> 32.81971, 32.73052, 32.64134, 32.63838, 32.…


head(mydata) |>
  tidy_TRHdata() |> # tidy
  add_time_vars() |> # add time factors
  add_humidity_calcs() |> # add humidity values
  add_conservation_calcs() |> # add conservation risks
  add_humidity_adjustments() # add environmental zones and RH adjustments
#> # A tibble: 6 × 64
#>   Site   Sensor date                 Temp    RH seasonyear      season monthyear
#>   <chr>  <chr>  <dttm>              <dbl> <dbl> <ord>           <ord>  <ord>
#> 1 London Room 1 2024-01-01 00:00:00  21.8  36.8 "winter\n(DJF)… winte… January …
#> 2 London Room 1 2024-01-01 00:15:00  21.8  36.7 "winter\n(DJF)… winte… January …
#> 3 London Room 1 2024-01-01 00:29:59  21.8  36.6 "winter\n(DJF)… winte… January …
#> 4 London Room 1 2024-01-01 00:44:59  21.7  36.6 "winter\n(DJF)… winte… January …
#> 5 London Room 1 2024-01-01 00:59:59  21.7  36.5 "winter\n(DJF)… winte… January …
#> 6 London Room 1 2024-01-01 01:14:59  21.7  36.2 "winter\n(DJF)… winte… January …
#> # ℹ 56 more variables: daylight <fct>, Date <dttm>, day <dttm>, hour <int>,
#> #   dayhour <dttm>, weekday <ord>, Month <dbl>, month <ord>, year <dbl>,
#> #   DayYear <date>, Summer <chr>, Period <chr>, Pws <dbl>, Pw <dbl>, DP <dbl>,
#> #   AH <dbl>, AD <dbl>, MR <dbl>, SH <dbl>, Enthalpy <dbl>, Mould_LIM <dbl>,
#> #   Mould_risk <chr>, Mould_rate <dbl>, Mould_index <dbl>,
#> #   PreservationIndex <dbl>, Lifetime <dbl>, EMC_wood <dbl>, TRH_within <lgl>,
#> #   T_lower <lgl>, T_higher <lgl>, RH_lower <lgl>, RH_higher <lgl>, …
Visualise and explore data
Combine calculations and plotting to explore patterns visually:
mydata |>
  # Calculate Absolute Humidity and Dew Point
  mutate(
    AbsHum = calcAH(Temp, RH),
    DewPoint = calcDP(Temp, RH)
  ) |>
  # Create base plot using graph_TRH function
  graph_TRH() +
  # Add Absolute Humidity line
  geom_line(aes(Date, AbsHum), color = "cyan4", alpha = 0.7) +
  # Add Dew Point line
  geom_line(aes(Date, DewPoint), color = "mediumvioletred", alpha = 0.7) +
  # Apply a theme
  theme_bw()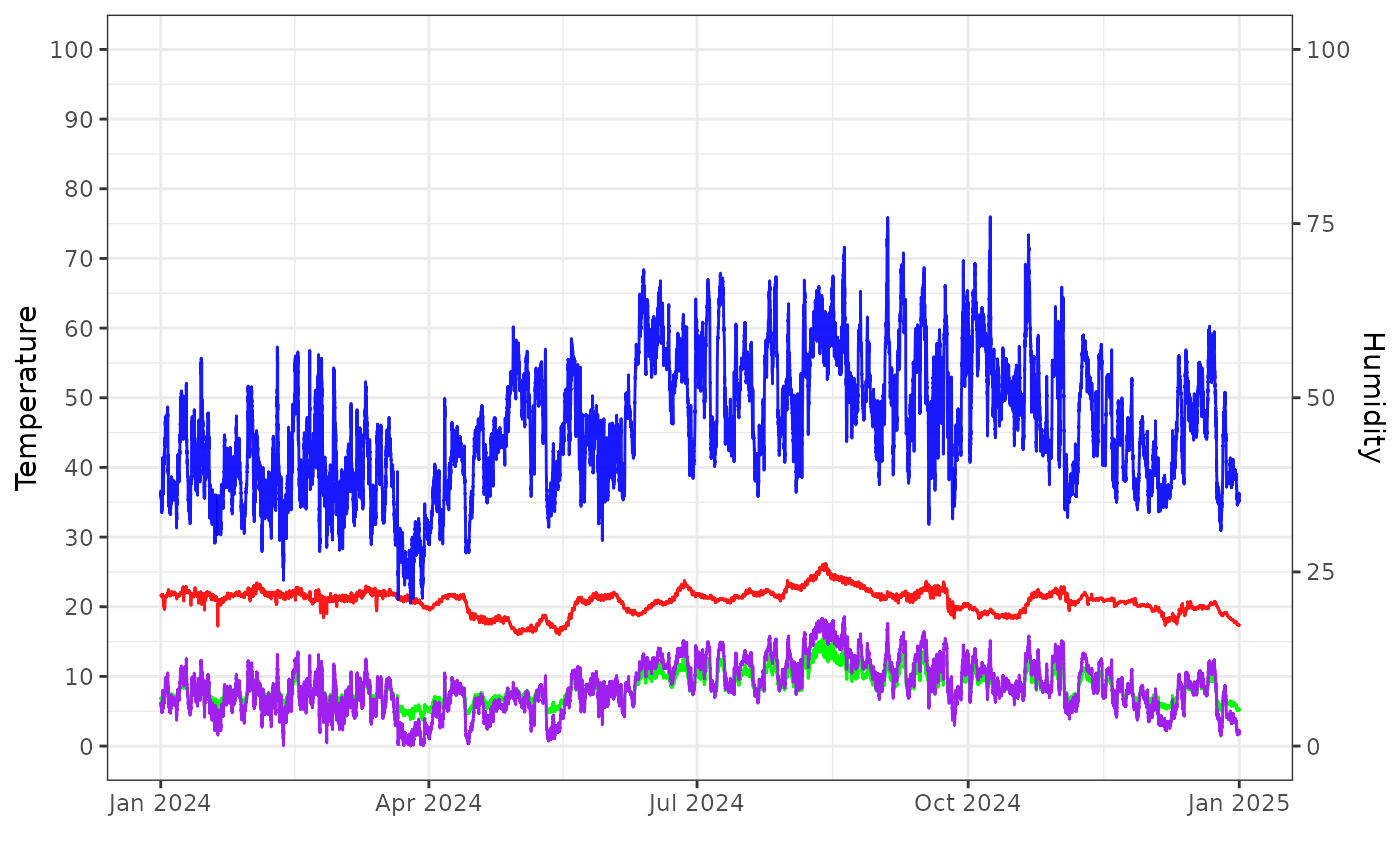
-
Conservator tools: mould growth index
Calculate mould growth index usingcalcMould_VTT()and visualise it alongside humidity data.
mydata |>
  mutate(Mould = calcMould_VTT(Temp, RH)) |>
  ggplot() +
  geom_area(aes(Date, Mould), fill = "lightseagreen") +
  labs(title = "Mould Growth Index", y = "Mould Index", x = NULL) +
  theme_bw()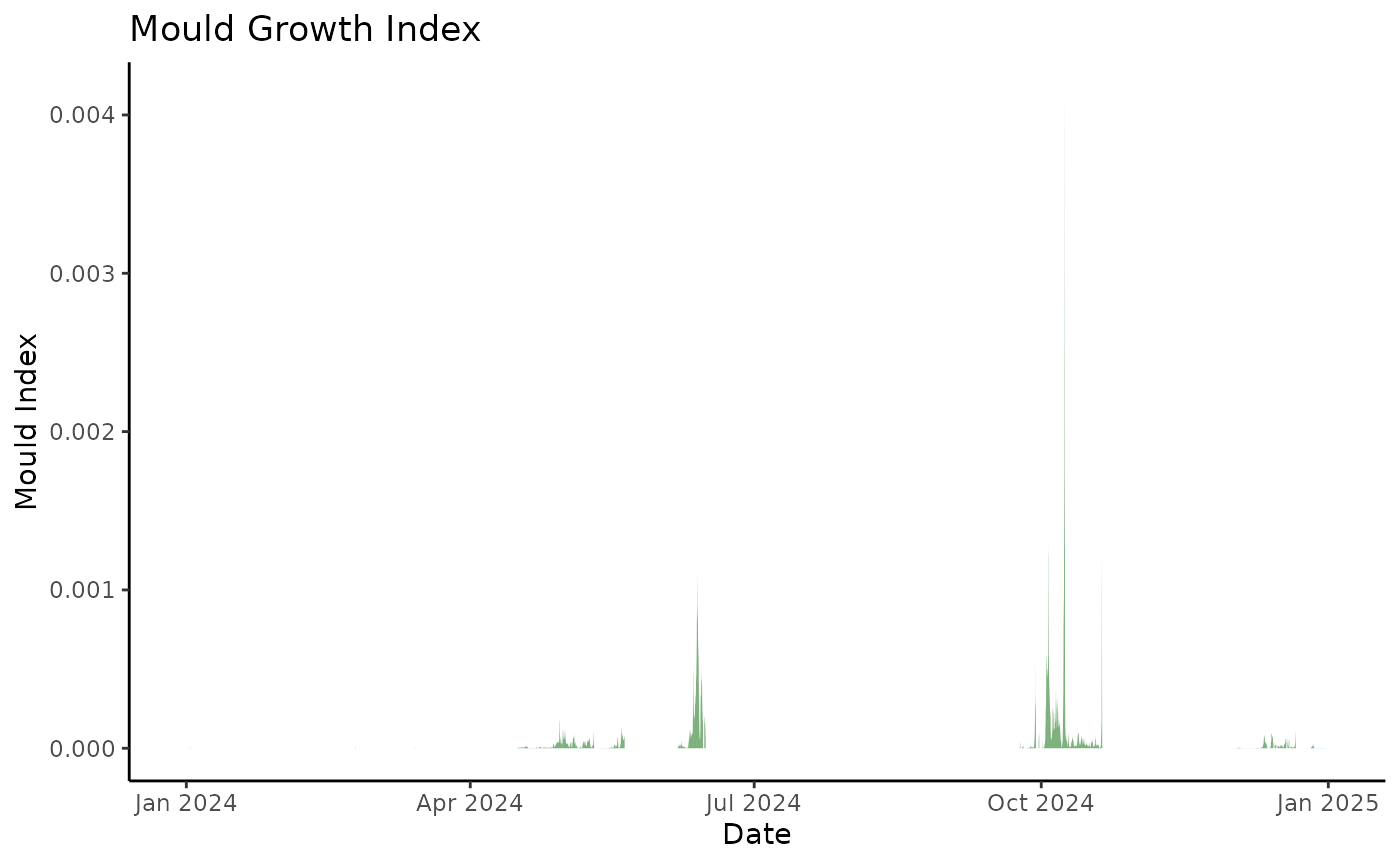
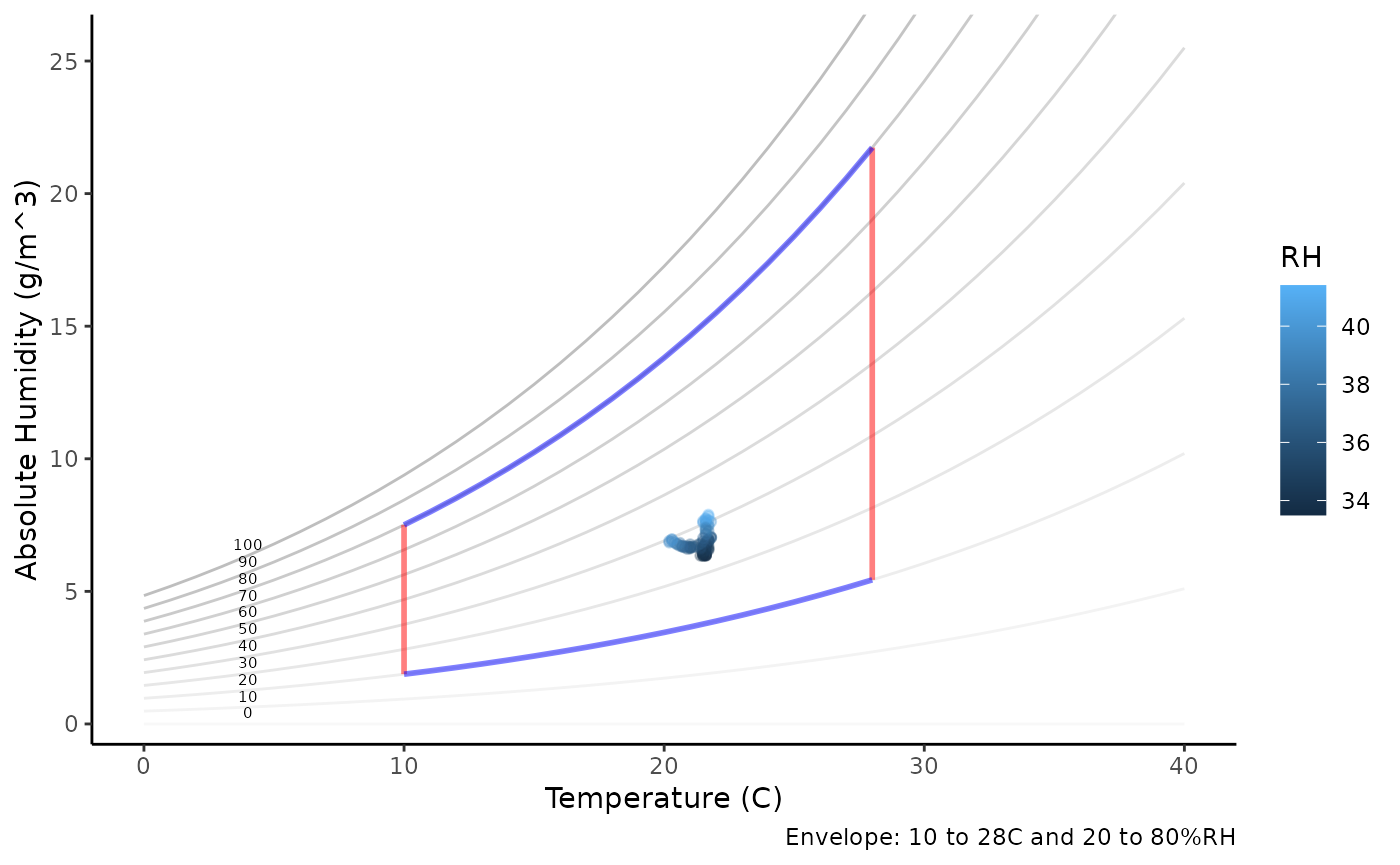
Psychrometric Chart
Create psychrometric charts from temperature and humidity data. The functions from the package can be used to change the calculations used.
head(mydata, 100) |>
  graph_psychrometric(
    LowT = 12,
    HighT = 28,
    LowRH = 40,
    HighRH = 70,
    data_alpha = 0.3,
    y_func = calcAH
  ) +
  theme_classic()