This function generates a psychrometric chart based on input temperature and relative humidity data.
Usage
graph_psychrometric(
  mydata,
  Temp = "Temp",
  RH = "RH",
  data_col = NULL,
  data_alpha = 0.5,
  LowT = 16,
  HighT = 25,
  LowRH = 40,
  HighRH = 60,
  Temp_range = c(0, 40),
  y_func = "calcMR",
  ...
)
Arguments
- mydata
A data frame containing temperature and relative humidity data.
- Temp
Column name in mydata for temperature values.
- RH
Column name in mydata for relative humidity values.
- data_col
Name of column to use for colouring points. Default is "Sensor" if present, otherwise "RH".
- data_alpha
Value to supply for make points more or less transparent. Default is 0.5.
- LowT
Numeric value for lower temperature limit of the target range. Default is 16°C.
- HighT
Numeric value for upper temperature limit of the target range. Default is 25°C.
- LowRH
Numeric value for lower relative humidity limit of the target range. Default is 40%.
- HighRH
Numeric value for upper relative humidity limit of the target range. Default is 60%.
- Temp_range
Numeric vector of length 2 specifying the overall temperature range for the chart. Default is c(0, 40).
- y_func
Function to calculate y-axis values. See above for options, default is mixing ratio (`calcMR`).
- ...
Additional arguments passed to y_func.
Details
Humidity and conservation functions can be used for the y-axis.
calcHR: Humidity Ratio (g/kg)
calcMR: Mixing Ratio (g/kg)
calcAH: Absolute Humidity (g/m^3)
calcSH: Specific Humidity (g/kg)
calcAD: Air Density (kg/m^3)
calcDP: Dew Point (°C)
calcFP: Frost Point (°C)
calcEnthalpy: Enthalpy (kJ/kg)
calcPws: Saturation vapor pressure (hPa)
calcPw: Water Vapour Pressure (hPa)
calcPI: Preservation Index
calcLM: Lifetime
calcEMC_wood: Equilibrium Moisture Content (wood)
Examples
# mydata file
filepath <- data_file_path("mydata.xlsx")
mydata <- readxl::read_excel(filepath, sheet = "mydata", n_max = 100)
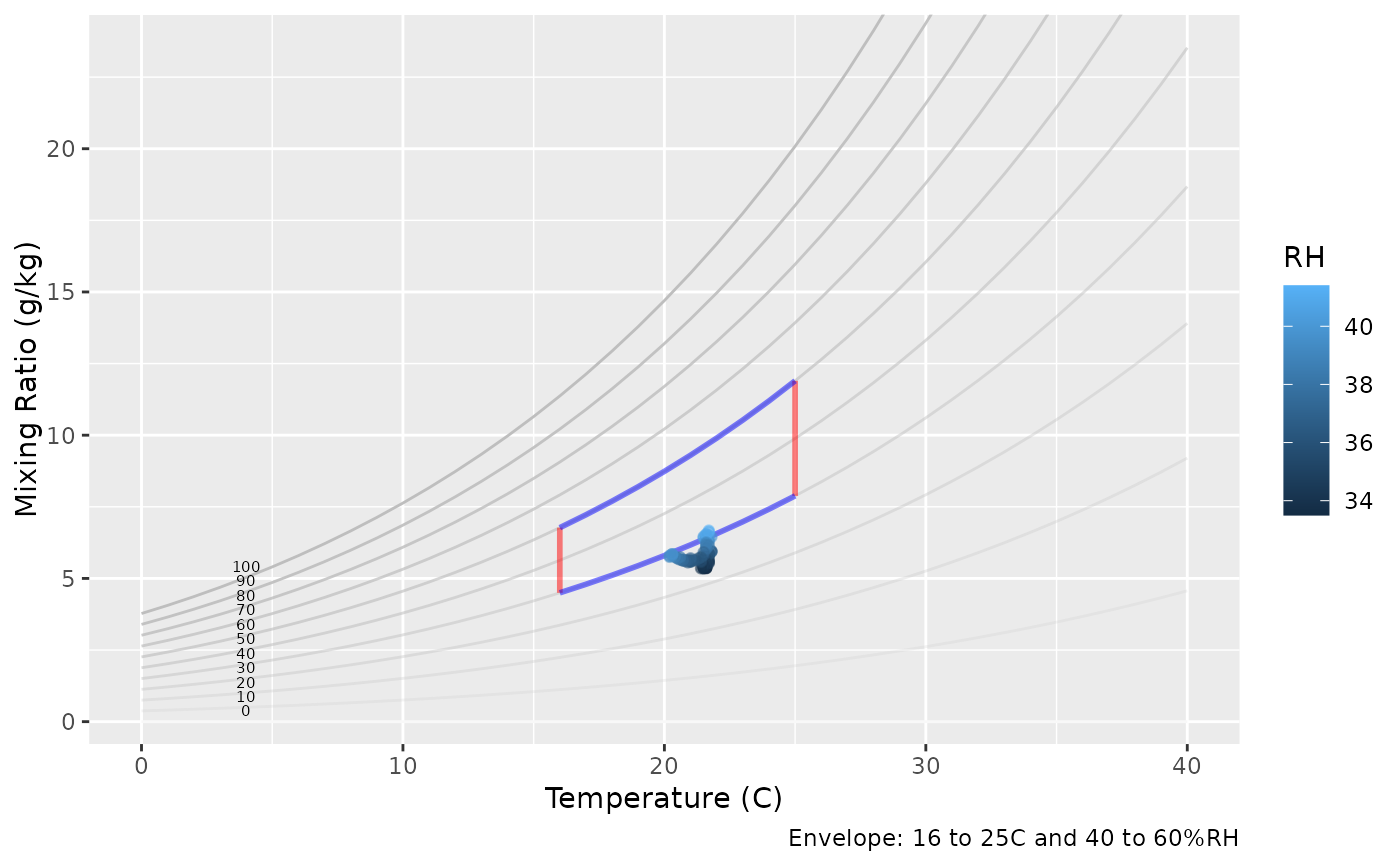
# Basic usage with default settings
graph_psychrometric(mydata, Temp, RH)
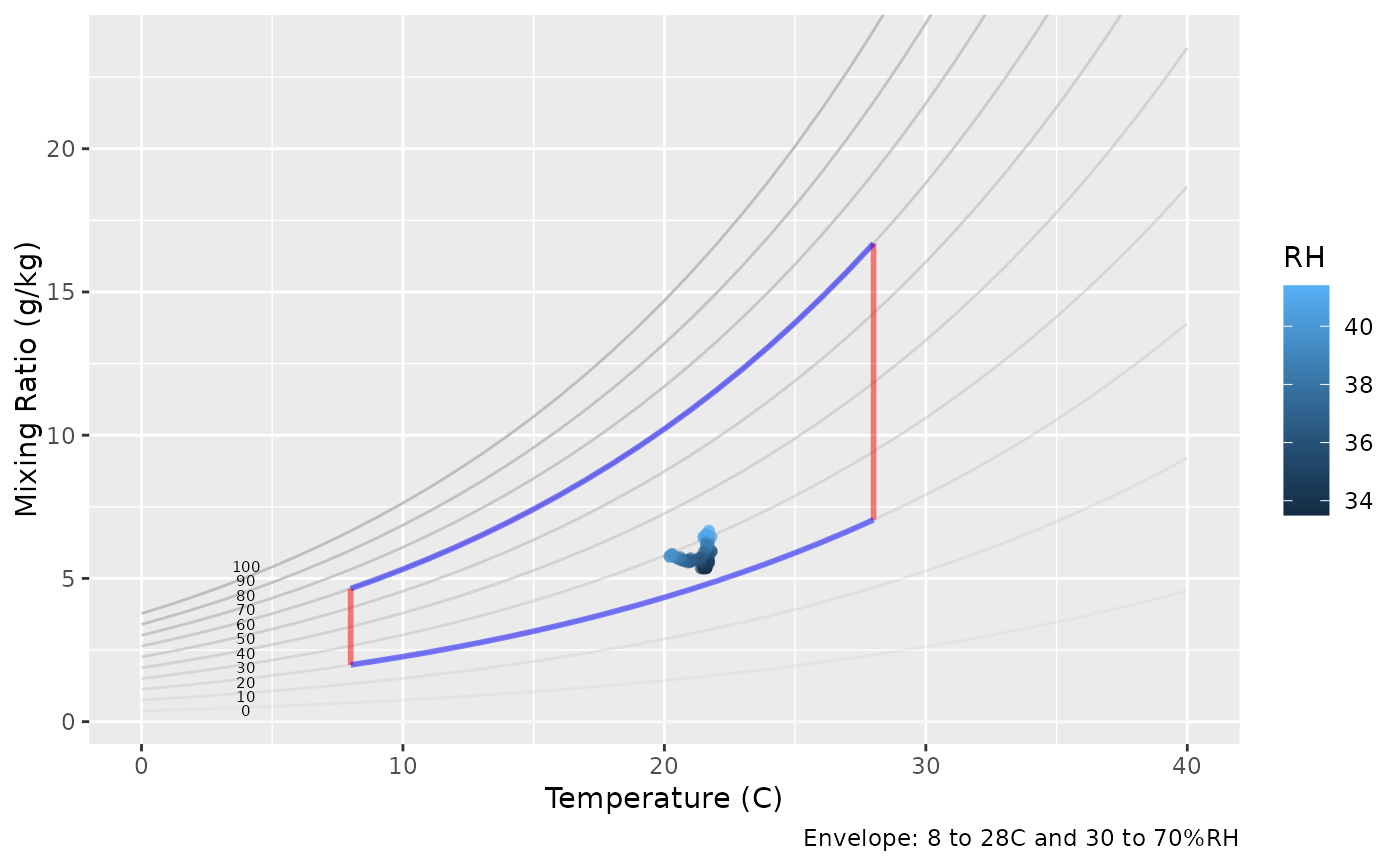
 # Custom temperature and humidity ranges
graph_psychrometric(mydata, Temp, RH, LowT = 8, HighT = 28, LowRH = 30, HighRH = 70)
# Custom temperature and humidity ranges
graph_psychrometric(mydata, Temp, RH, LowT = 8, HighT = 28, LowRH = 30, HighRH = 70)
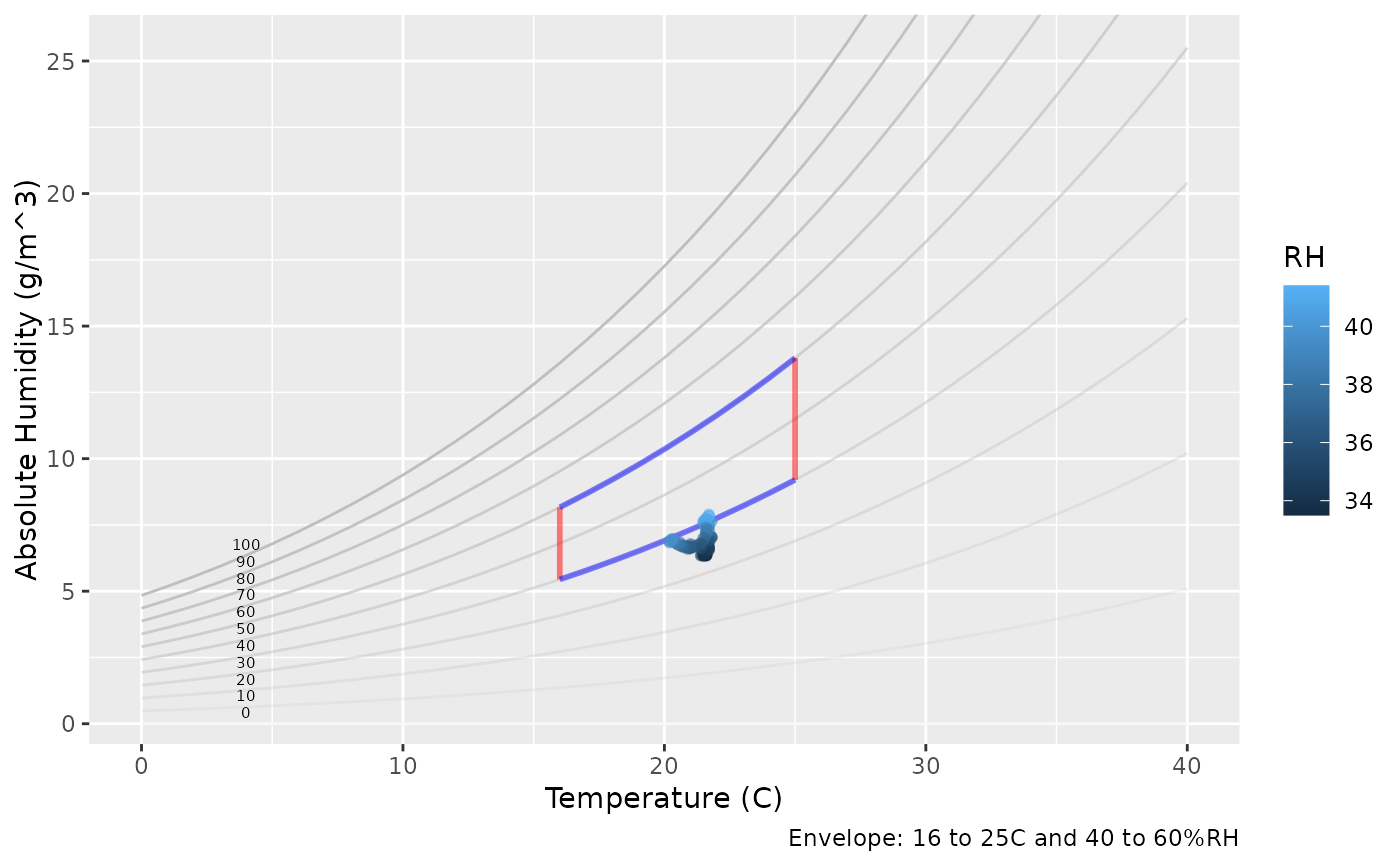
 # Using a different psychrometric function (e.g., Absolute Humidity)
graph_psychrometric(mydata, Temp, RH, y_func = calcAH)
# Using a different psychrometric function (e.g., Absolute Humidity)
graph_psychrometric(mydata, Temp, RH, y_func = calcAH)
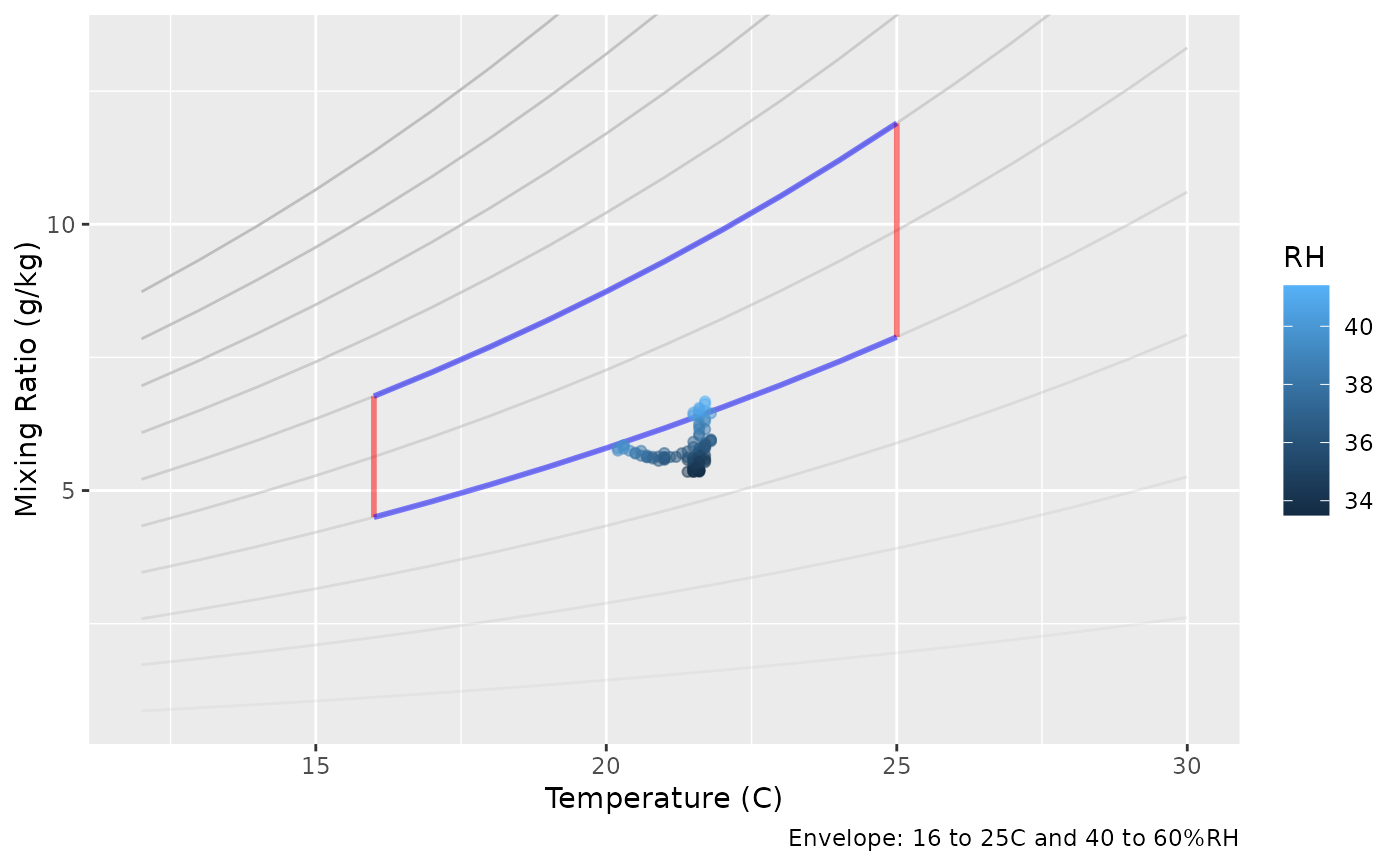
 # Adjusting the overall temperature range of the chart
graph_psychrometric(mydata, Temp, RH, Temp_range = c(12, 30))
# Adjusting the overall temperature range of the chart
graph_psychrometric(mydata, Temp, RH, Temp_range = c(12, 30))